Let’s say we have this code that isn’t working.
// some code we inherited, we don't get it, now what?
function findUsers(users, age) {
  var hits = new Array([]);

  for(var i=0; i<(users.length); i++){
    if (users[i].age < age) {
      hits.push(users[i]);
    }
  }

  return hits;
}
It’s causing some issues somewhere else and we have no idea what root cause is. In the real world, ending up at a tiny piece of code where we think the problem lies is very lucky. This is probably the result of lots of tracing and investigative work. But let’s just pretend that we ended up here.
We’re going to walk through our approach and challenge ourselves to think about why and how we are thinking. We ourselves are not going to turn into computer compilers or syntax interpreters. But before that, we’ll study the anti-patterns first.
When you are trying to figure out something that is broken or even develop something to make something new:
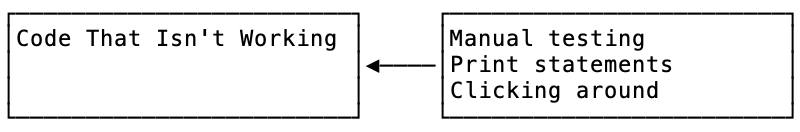
Anti Pattern 1 - The Human Interpreter
If I ran into this bit of code, the first thing I’d not do is grab my chin and stare at each line, trying to catch the bug. I don’t want to do this because the bug is usually not as obvious as this example (it might not be obvious to you, that’s ok). So, staring at the code is healthy and normal but this is not the core of our process. What we’re going to do is get a feel for the code by exercising and playing with it.
Anti Pattern 2 - Print Statements
You might be tempted to start dropping console.log() statements all over the place. I do this too but I try to get away from this as fast as I can. Print statements are throwaway code and mostly a waste of time (in general). You can get something that works much better as a one-liner (breakpoint) or a mouse click (breakpoint).
Anti Pattern 3 - Opening a Shell
Node / Python / Ruby and other languages have an interactive shell called a REPL. You could copy and paste the above function and mess around it in a REPL. This is great for learning and is completely on the right track.
The problem is, what is users and age? Age is probably a number. But even if we know what users is, we have to type it in. And, if we want to experiment on the function itself, we have to type that in too to redefine it. In some REPLs this can be very annoying because of whitespace and syntax.
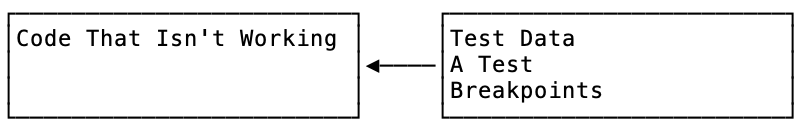
A Debugging Workflow
First, you need tests. If your project doesn’t have tests, this won’t work as well. You’ll have to pay the cost to make that happen or step back a bit. I’ll have a section about finding a workaround.
Every test follows a pattern:
- Setup
- Execute
- Assert or Test
What we do is create some dummy data to expose the bug for the Setup.
// setup
let john = { name: "John", age: 25 };
let pete = { name: "Pete", age: 30 };
let mary = { name: "Mary", age: 28 };

let users = [ pete, john, mary ];
And then we call the function as execute:
// execute
var result = findUsers(users, 29)
And then we can tell the computer to fail if it is not what we expect. First, let’s define what we expect. This function seems to want to find users under a certain age. So the answer should be John and Mary:
var expected = [ { name: 'John', age: 25 }, { name: 'Mary', age: 28 } ]
And then we assert in whatever testing library we are using. This test is going to fail at this point (that’s the bug). So, now we have a failing test. But more importantly, we don’t have to keep typing our function or our data over and over again in a REPL to play around with it.
But wait! We haven’t outperformed simple print statements yet!
First, let’s get our test created with some module and importing boilerplate.
var findUsers = require('./repl_debugging.js');

describe("finding users", () => {

  it("finds users under a certain age", () => {
    // setup
    let john = { name: "John", age: 25 };
    let pete = { name: "Pete", age: 30 };
    let mary = { name: "Mary", age: 28 };

    let users = [ pete, john, mary ];

    // execute
    var result = findUsers(users, 29);
    var expected = [ { name: 'John', age: 25 }, { name: 'Mary', age: 28 } ];

    // assert or test, jest uses expect
    expect(result).toStrictEqual(expected);
  })

})
The main file looks like this:
// something we inherited, we don't get it
var findUsers = function findUsers(users, age) {
  var hits = new Array([]);

  for(var i=0; i<(users.length); i++){
    if (users[i].age < age) {
      hits.push(users[i]);
    }
  }

  return hits;
}

module.exports = findUsers;
We’re going to put a debugger; print statement in to break in our code.
Now unfortunately, some languages are easier to debug than others. You might be using javascript for a web frontend in which case you’re going to need to figure out chrome or firefox developer tools or wire up a VSCode or other editor/IDE config to enable breakpoints and interactive debugging.
For now, I’m going to show you NDB and this flow.
Run this command to watch tests and run our debugger
ndb $(npm bin)/jest --watchAll --runInBand
First, our breakpoint breaks in this function and when we hover over variables we can see their values without console.log().
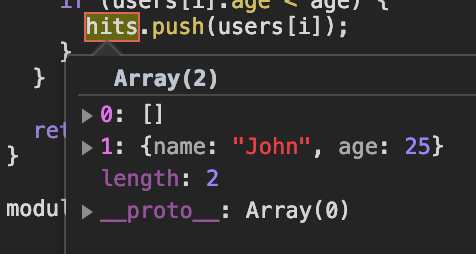
Now we see that the element at 0 is wrong. We need to fix that.
We change the line to be
// something we inherited, we don't get it
var findUsers = function findUsers(users, age) {
  var hits = new Array();
And the test passes. Now you could refactor that for loop into a map or something. :)
I Don’t Have Tests!
Create a file that executes the function with setup data. You’re basically making a test suite yourself. This is close enough to the nice REPL + test workflow that you might be able to make it worth it. In this case at least you don’t have to type the test data over and over again. When I find myself doing this, I copy it into a test. Once I have it in a test, I can drop REPL breakpoints in.
The Big Lesson
- Put your setup and dummy data into a file
- This file can be a test.js file in a
testsfolder - If you do this, your debugging becomes a test
- You can put breakpoints in code or in a test
- If you put breakpoints in the test, you can break and inspect outside of the code
- If you put breakpoints in the code, you get all your test data and setup in the REPL session, no typing over and over again
- You can add/remove breakpoints and have your test suite run all the time
Doing these things creates a steady feedback loop. In addition, if you develop an algorith in the REPL shell, just copy it into the code. If you find some useful test data in the REPL shell, copy it into the test.
Playing around in a REPL from inside in a test run is a great way to develop algorithms, methods, test data and expectations that your probably need to save in a file anyway
The anti-patterns aren’t “evil” or “wrong”. I just prefer the REPL + test flow for all the previous reasons listed and it sets us up for other things like refactoring and stability.